 Figure 1.
The driving rain measurements are carried out on the west façade of the Main Building, on the campus of the Eindhoven University of Technology (TUE). See fig. 1. Reference windspeed and rain intensity are measured on the roof of the Auditorium. The full-scale measurements started in December 1997 and went till January 2001.
The main building is seen in the middle of fig. 1; the auditorium is seen at the bottom-left side of the picture.
Fig. 2 (westfacade), fig. 3 (view from north) and fig. 4 (plan) show the exact measurement positions.
The table below gives an overview of the quantities measured the instrumentation:
| position | quantity | instrument | (output) sample rate |
| P1 | wind velocity (3d) | Solent Research Ultrasonic Anemometer | 1 / min |
| P2 | horizontal rain intensity | Young tipping bucket rain gauge 52202 | 2 / min |
| P3 | horizontal rain intensity | Young tipping bucket rain gauge 52202 | 2 / min |
| P3 | duration of horizontal rain | rain indicator | 2 / min |
| P3 | raindrop spectrum (from December 1998) |
disdrometer (IMK) | 2 / min |
| P4 | wind velocity (3d) at 50--125 cm from facade surface | Solent Windmaster 1086M Ultrasonic Anemometer | 1 / s |
| P4 or P5 | driving rain intensity | driving rain collector TUE-I without wiper + balance Mettler PB 3001 | 4 / min |
| P5 or P4 | driving rain intensity | driving rain collector TUE-II with wiper + balance Mettler PB 3001 | 4 / min |
| P7 | driving rain intensity (from Sept. 1998) |
driving rain collector CTH | 2 / min |
| P7 | driving rain intensity (from Sept. 1998) |
driving rain collector TUD | 2 / min |
| P6 | driving rain intensity | driving rain collector TUE-II with wiper + balance Mettler PB 3001 | 4 / min |
The configuration at the central facade position P4/P5/P6 was changed a few times. The first configuration you see in figure 6, with the driving rain gauges developped at the TUE. In September 1998 the configuration changed to add two driving rain gauges for the international comparision test (figure 9).
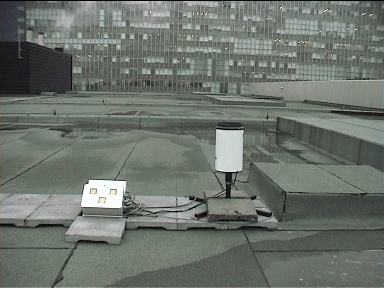
Here is a picture of the rain indicator and the tipping bucket rain gauge at position P3 (on the roof of the Auditorium):
 Figure 5a.
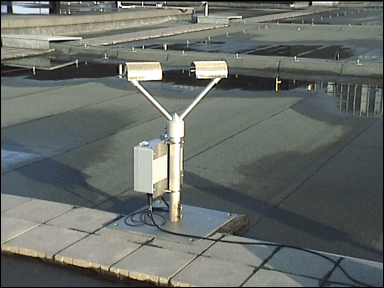
The disdrometer at position P3 was installed in December 1998:
 Figure 5b.
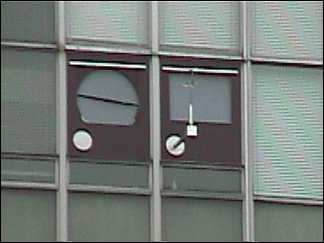
 Figure 6 (Dec. 1997 - Jul. 1998).
The above picture shows two driving rain gauges mounted in the west facade of the Main Building (10th floor, at position P4 and P5). It shows also the anemometer on the arm for the measurements of the wind velocity near to the facade.
At the right side the driving rain gauge is a traditional one, without wiper (TUE-I). At the left side a driving rain gauge with wiper (TUE-II) is installed. The catch area of both gauges is approx. 0.5 m2. A driving rain gauge consists of:
The weight of the reservoir is constantly measured and logged by a computer. The purpose of the wind deflector is to prevent that the wind blows onto the reservoir while the rainwater is let into the reservoir. Details of driving rain gauge TUE-II are shown in fig. 7 and fig. 8.
The wiper of driving rain gauge II is switched on when the rain indicator on the roof of the Auditorium senses rain.
In collaboration with Anneli Högberg (Chalmers Tekniska Högskola, Göteborg) and Mikkel Kragh (Danmarks Tekniske Universitet, Lyngby), an international driving rain gauge test was set up in Eindhoven in July 1998. Everyone had developed his/her own device, according to different principles. The gauges involved in the comparison are listed and depictured in the table:
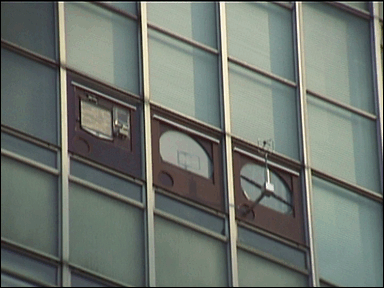
Gauge CTH is from Anneli; Mikkel developed the gauge called DTU. Below one sees the four driving rain gauges at position P7/P5/P6 on the west facade of the Main Building:
 Figure 9 (Sept. 1998 -
Mar. 1999).
From left to right: DTU, CTH, TUE-I and TUE-II.
Fabien J.R. van Mook, Description of the measurement set-up for wind and driving rain at the TUE, internal report FAGO 98.04.K, March 1998, Eindhoven University of Technology (PDF-file: 1509 kbyte)
Anneli Högberg, Mikkel Kragh and Fabien van Mook, A comparison of driving rain measurements with different gauges, Proceedings of the 5th Symposium of Building Physics in the Nordic Countries, Göteborg (SE), 24-26 August 1999, p. 361-368 (PDF-file: 247 kbyte)
Fabien J.R. van Mook, Driving rain on building envelopes, Ph. D. thesis, Technische Universiteit Eindhoven, 2002 (PDF-file: 2857 kbyte)
Back to home page http://sts.bwk.tue.nl/drivingrain/.
© 2002 Technische Universiteit Eindhoven/ Fysische Aspekten van de Gebouwde Omgeving
Last update: 13 December 2002.